𐐔𐐯
Latter-day Stats
  • Home
  • Channels
  • Studies
  • Data Explorer

Shelves

  • Use with AI
  • Contact
  • Donate

Samuel Baird projects

  • Latter-day Stats
  • Deseret Wiki
  • Urim
  • Pulpitcontributor
  • Deseret MCP
  • Peepstone
  • Omni
  • Sacred Sites Visited
  • My Reading
  • Collection
All projects →
  • About Latter-day Stats
  • samuelbaird.com

𐐢𐐰𐐻𐐲𐑉-𐐼𐐩 Stats

Latter-day Stats A Samuel Baird project
Sign in
Latter-day Stats

Statistics, research, and creator data on the Latter-day Saint community. Not affiliated with The Church of Jesus Christ of Latter-day Saints.

A project by Samuel Baird.

ChannelsStudiesData ExplorerUse with AIAboutFAQHall of ShameContactDonate
TermsPrivacyCopyrightAccessibility

Latter-day Stats

𐐢𐐰𐐻𐐲𐑉-𐐼𐐩 Stats

Statistics, research and creator data on the Latter-day Saint community. Made by Samuel Baird. Free, independent and ad-free.

samuelbaird.com · All projects · About Latter-day Stats

Also by Samuel Baird: Deseret Wiki · Urim · Pulpit · Deseret MCP · Peepstone · Omni

© 2026 Samuel Baird. Set in IM Fell English, Libre Baskerville, Cinzel & Noto Sans Deseret, after the Deseret Wiki.

Data Explorer

CES Stacked, 2006–2018

Cooperative Election Studies (multi-university consortium) · YouGov

Ryan Burge's own tabulation stacking eight waves of the CCES/CES common content (2006–2018) down to five variables — religious tradition, 7-point party ID, race, gender, and year — for tracking a group's partisanship over time rather than in a single snapshot. It carries 5,955 Latter-day Saint respondents across the eight waves, enough to break that group out by year and by gender and still have a usable sample in most cells.
Graphics

1 graphic

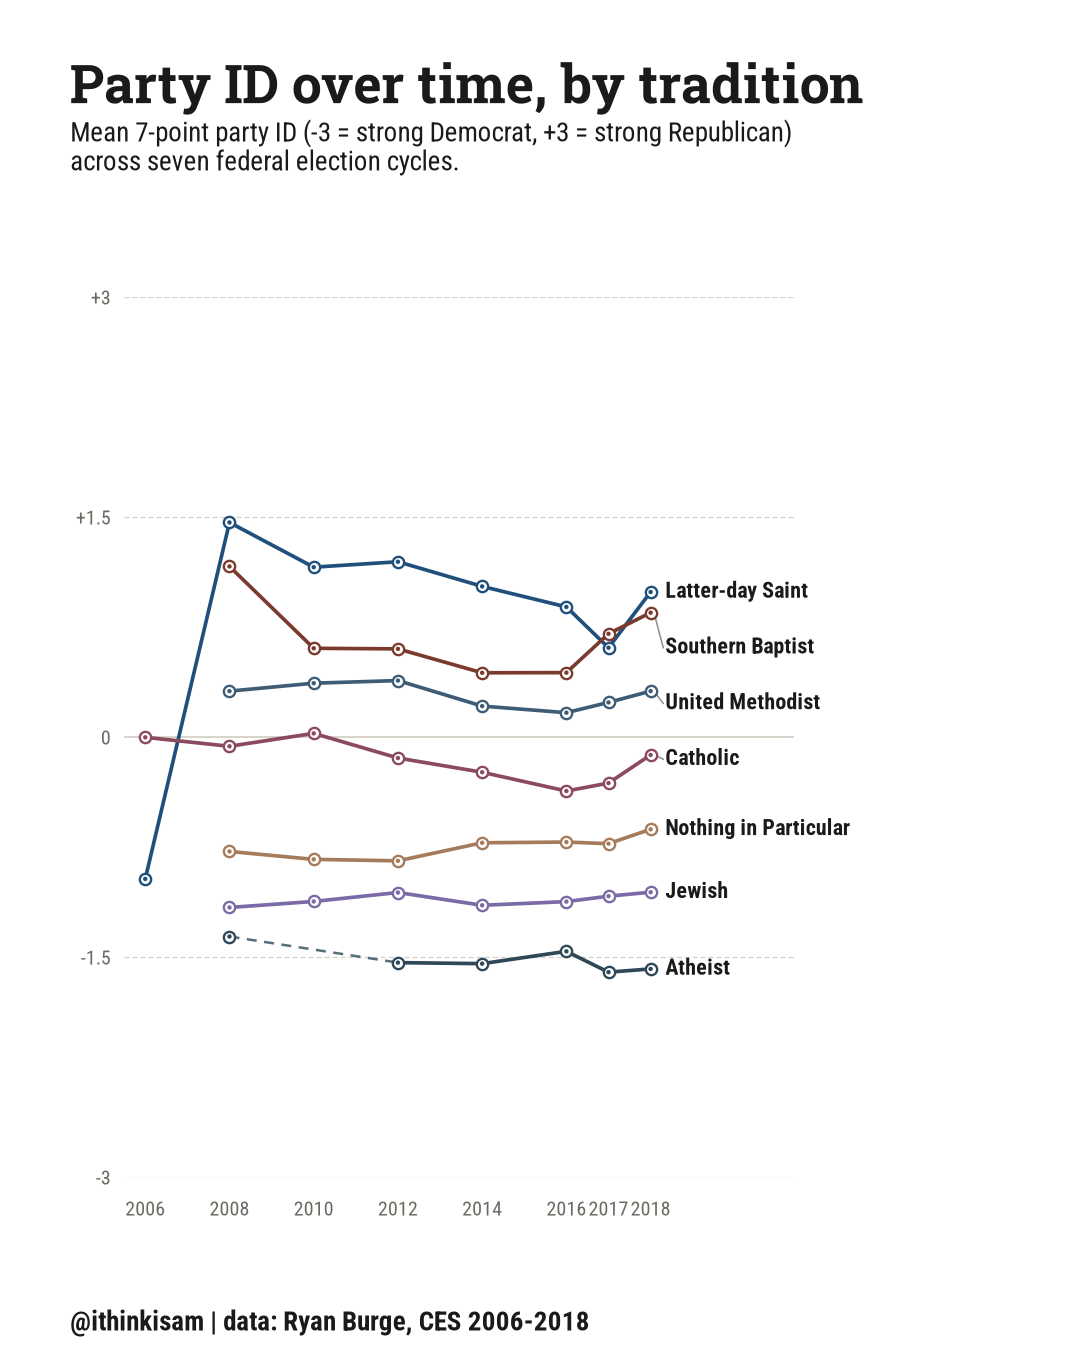
Line chart, mean 7-point party ID by tradition and survey wave. Latter-day Saint: 2006 -0.97, 2008 1.46, 2010 1.16, 2012 1.20, 2014 1.03, 2016 0.89, 2017 0.61, 2018 0.99; Catholic: 2006 -0.00, 2008 -0.06, 2010 0.03, 2012 -0.14, 2014 -0.24, 2016 -0.37, 2017 -0.31, 2018 -0.12; Southern Baptist: 2008 1.16, 2010 0.60, 2012 0.60, 2014 0.44, 2016 0.44, 2017 0.70, 2018 0.85; United Methodist: 2008 0.31, 2010 0.37, 2012 0.39, 2014 0.21, 2016 0.17, 2017 0.24, 2018 0.31; Nothing in Particular: 2008 -0.78, 2010 -0.83, 2012 -0.84, 2014 -0.72, 2016 -0.72, 2017 -0.73, 2018 -0.63; Atheist: 2008 -1.36, 2012 -1.54, 2014 -1.54, 2016 -1.46, 2017 -1.60, 2018 -1.58; Jewish: 2008 -1.16, 2010 -1.12, 2012 -1.06, 2014 -1.15, 2016 -1.12, 2017 -1.08, 2018 -1.06.
View all graphics